> ## Documentation Index
> Fetch the complete documentation index at: https://resources.athenaintel.com/llms.txt
> Use this file to discover all available pages before exploring further.
# Build Interactive Financial Dashboards with Athena
> Financial dashboards turn spreadsheet data into user interfaces with metric cards, charts, filters, version history, live previews, and shareable links.
Athena's User Interface toolkit enables teams to transform spreadsheet data into interactive, professional dashboards with simple natural language commands. The system automatically generates fully functional web applications with charts, filters, and visualizations that can be shared with anyone, even those without Athena access.
By converting static data into dynamic, interactive interfaces, Athena helps finance teams, analysts, and business leaders present insights more effectively and make data-driven decisions faster. The generated dashboards support real-time filtering, multiple visualization types, and responsive layouts that work seamlessly across devices.
## Step-by-step Instructions
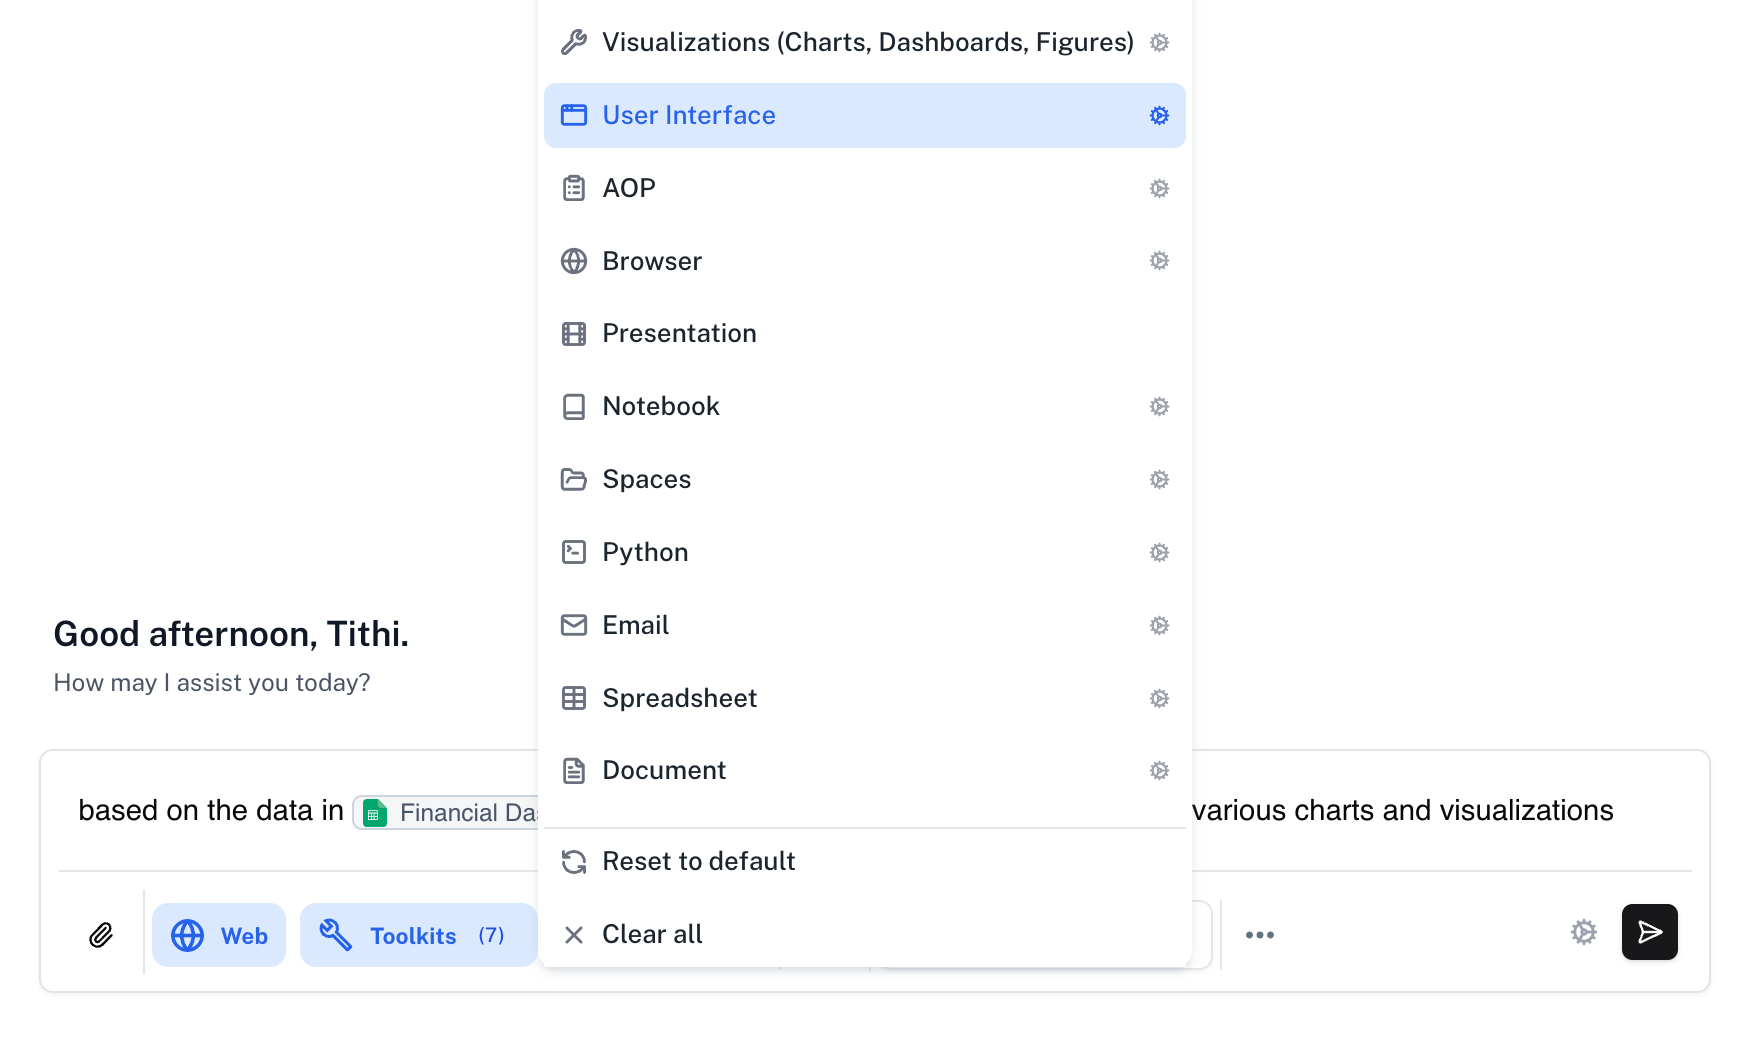
Go to [**Spaces**](https://app.athenaintel.com/dashboard/spaces). Click on the **Toolkits** button and select the **User Interface** toolkit from the available options. Then enter your prompt in **Chat** and press **Enter**.
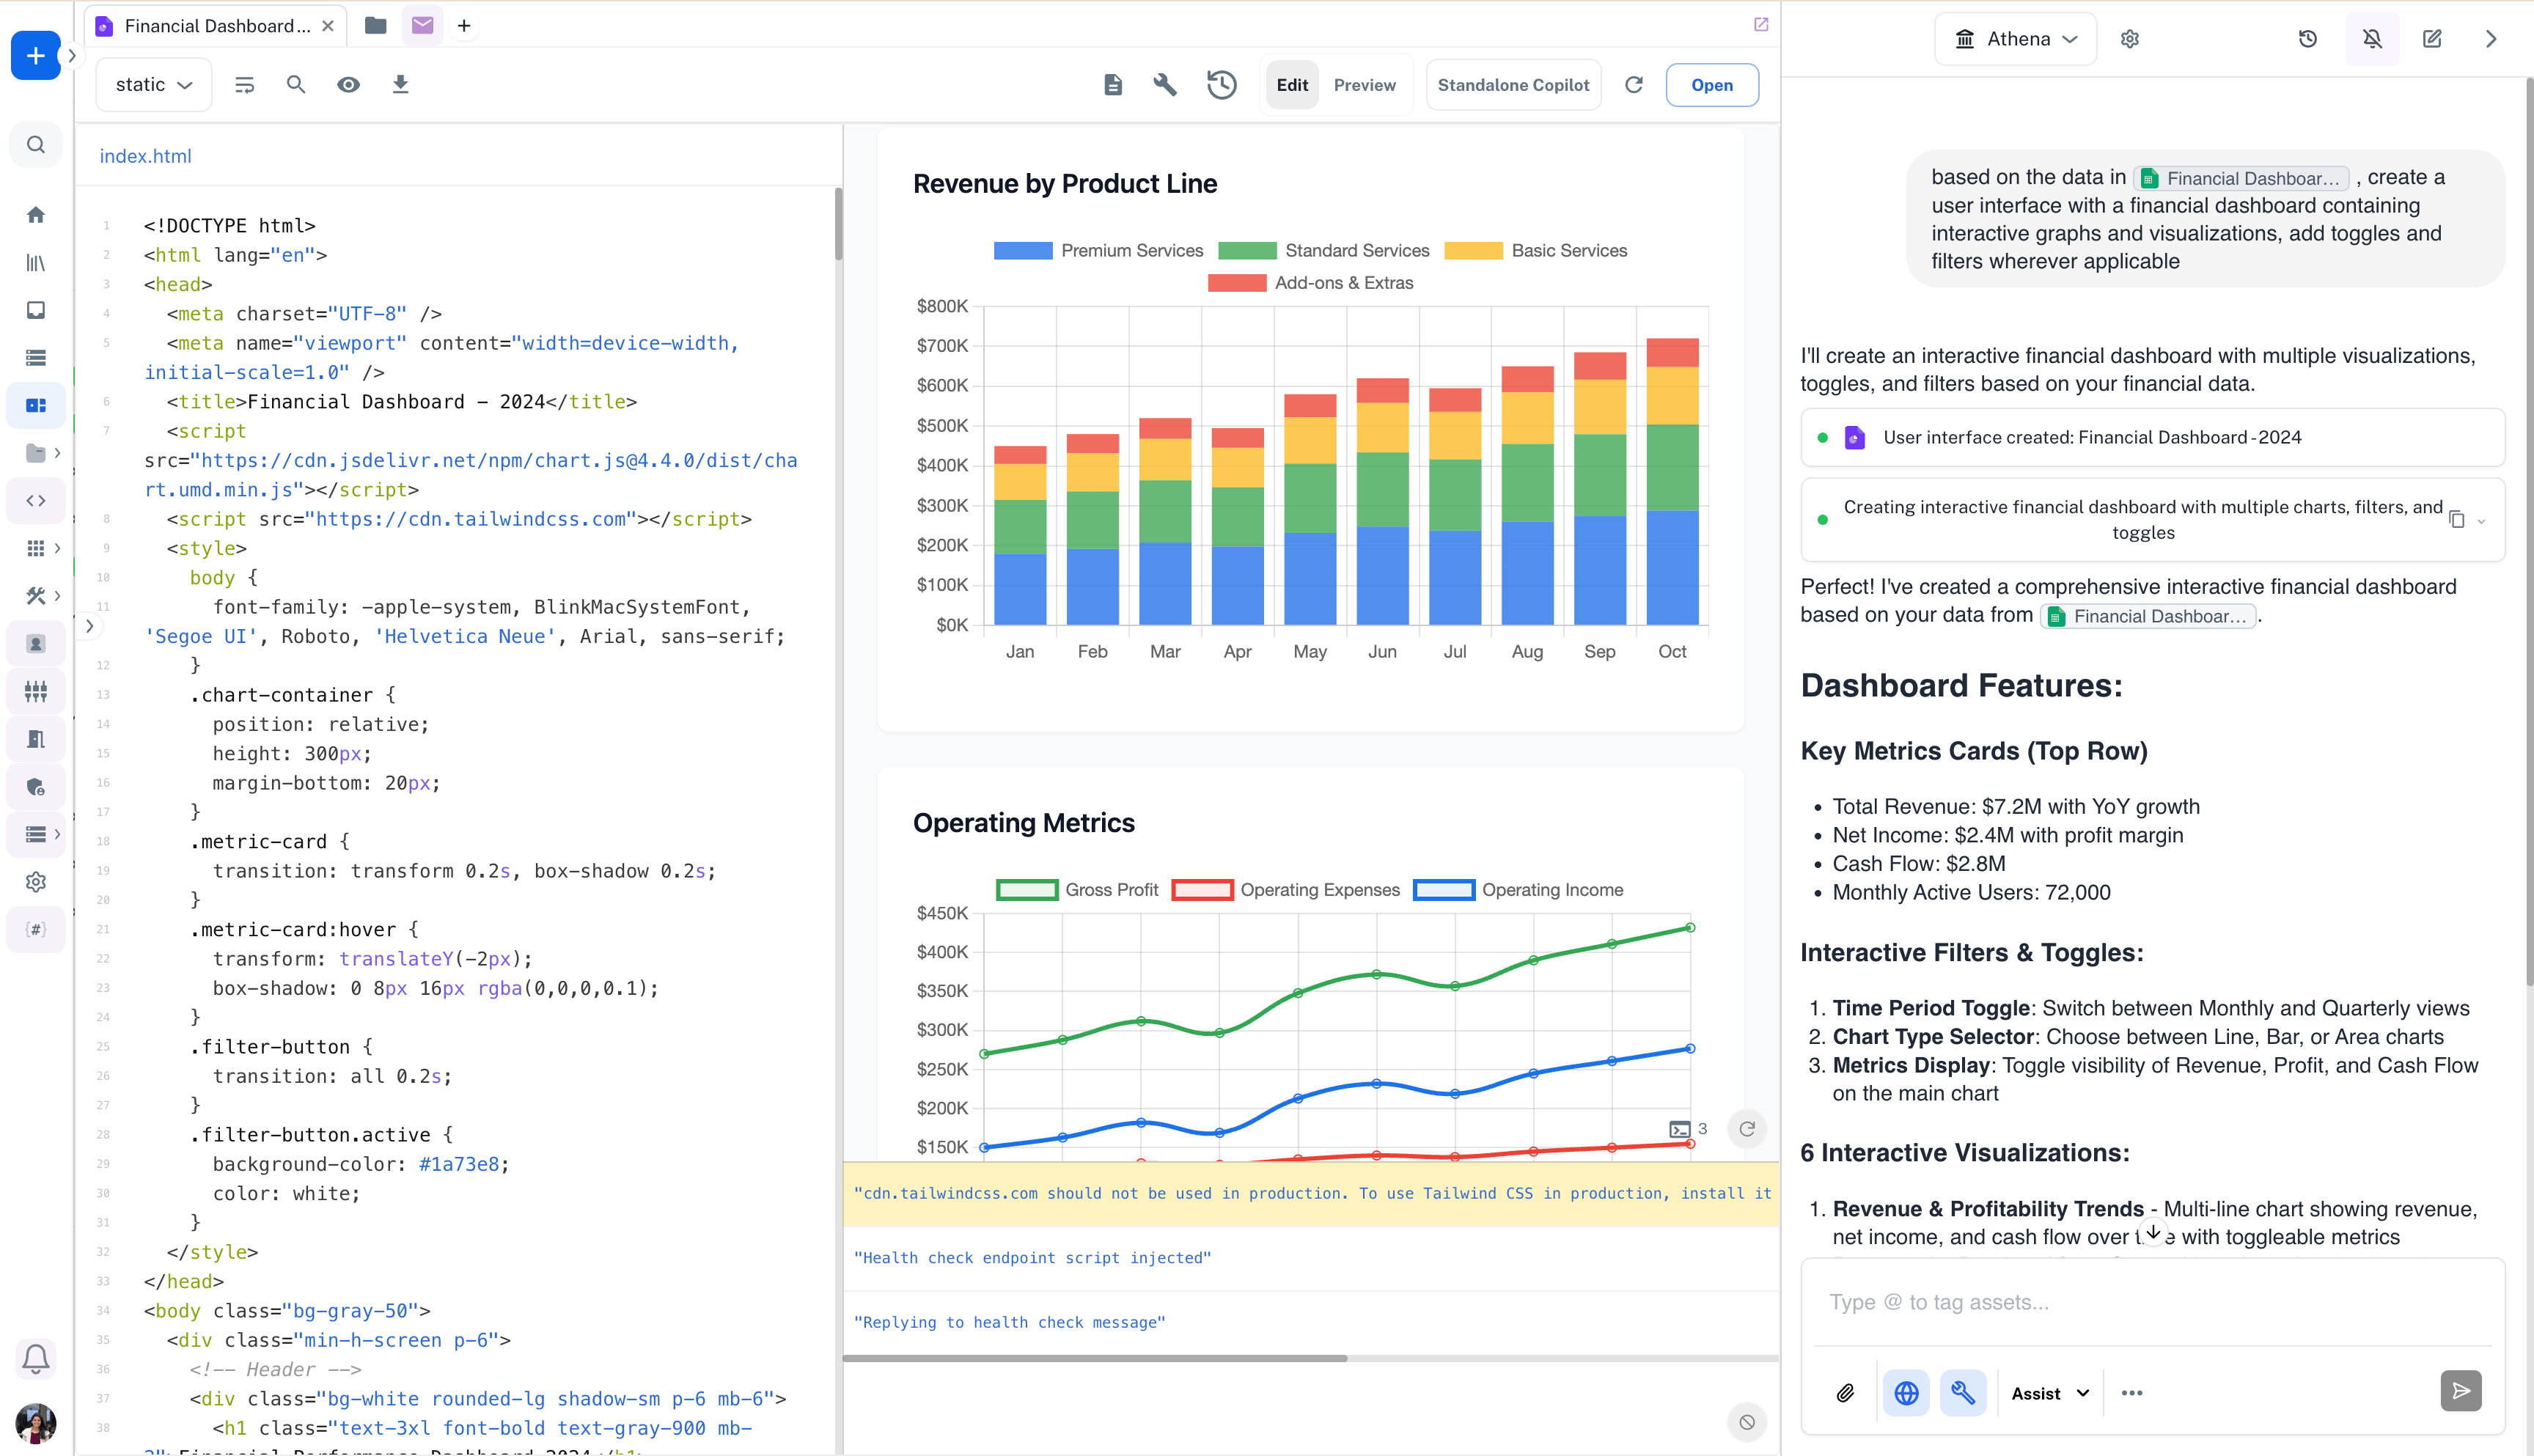
Based on the data in Financial Dashboard 2024, create a user interface with a financial dashboard containing interactive graphs and visualizations and filters wherever applicable
Make sure that the **Assist** persona is selected and the **User Interface** toolkit is enabled before submitting your prompt. The User Interface toolkit is required to generate interactive dashboards.
 Athena will create an interactive user interface asset that appears in your workspace. The generated dashboard includes multiple visualizations, interactive filters, and a clean, professional layout. These user interface assets support versioning, allowing you to safely return to previous versions if needed. You can view the code implementation on the left panel and the live preview on the right.
 User interface assets can also be used to generate form inputs, data entry screens, and other interactive components beyond dashboards.
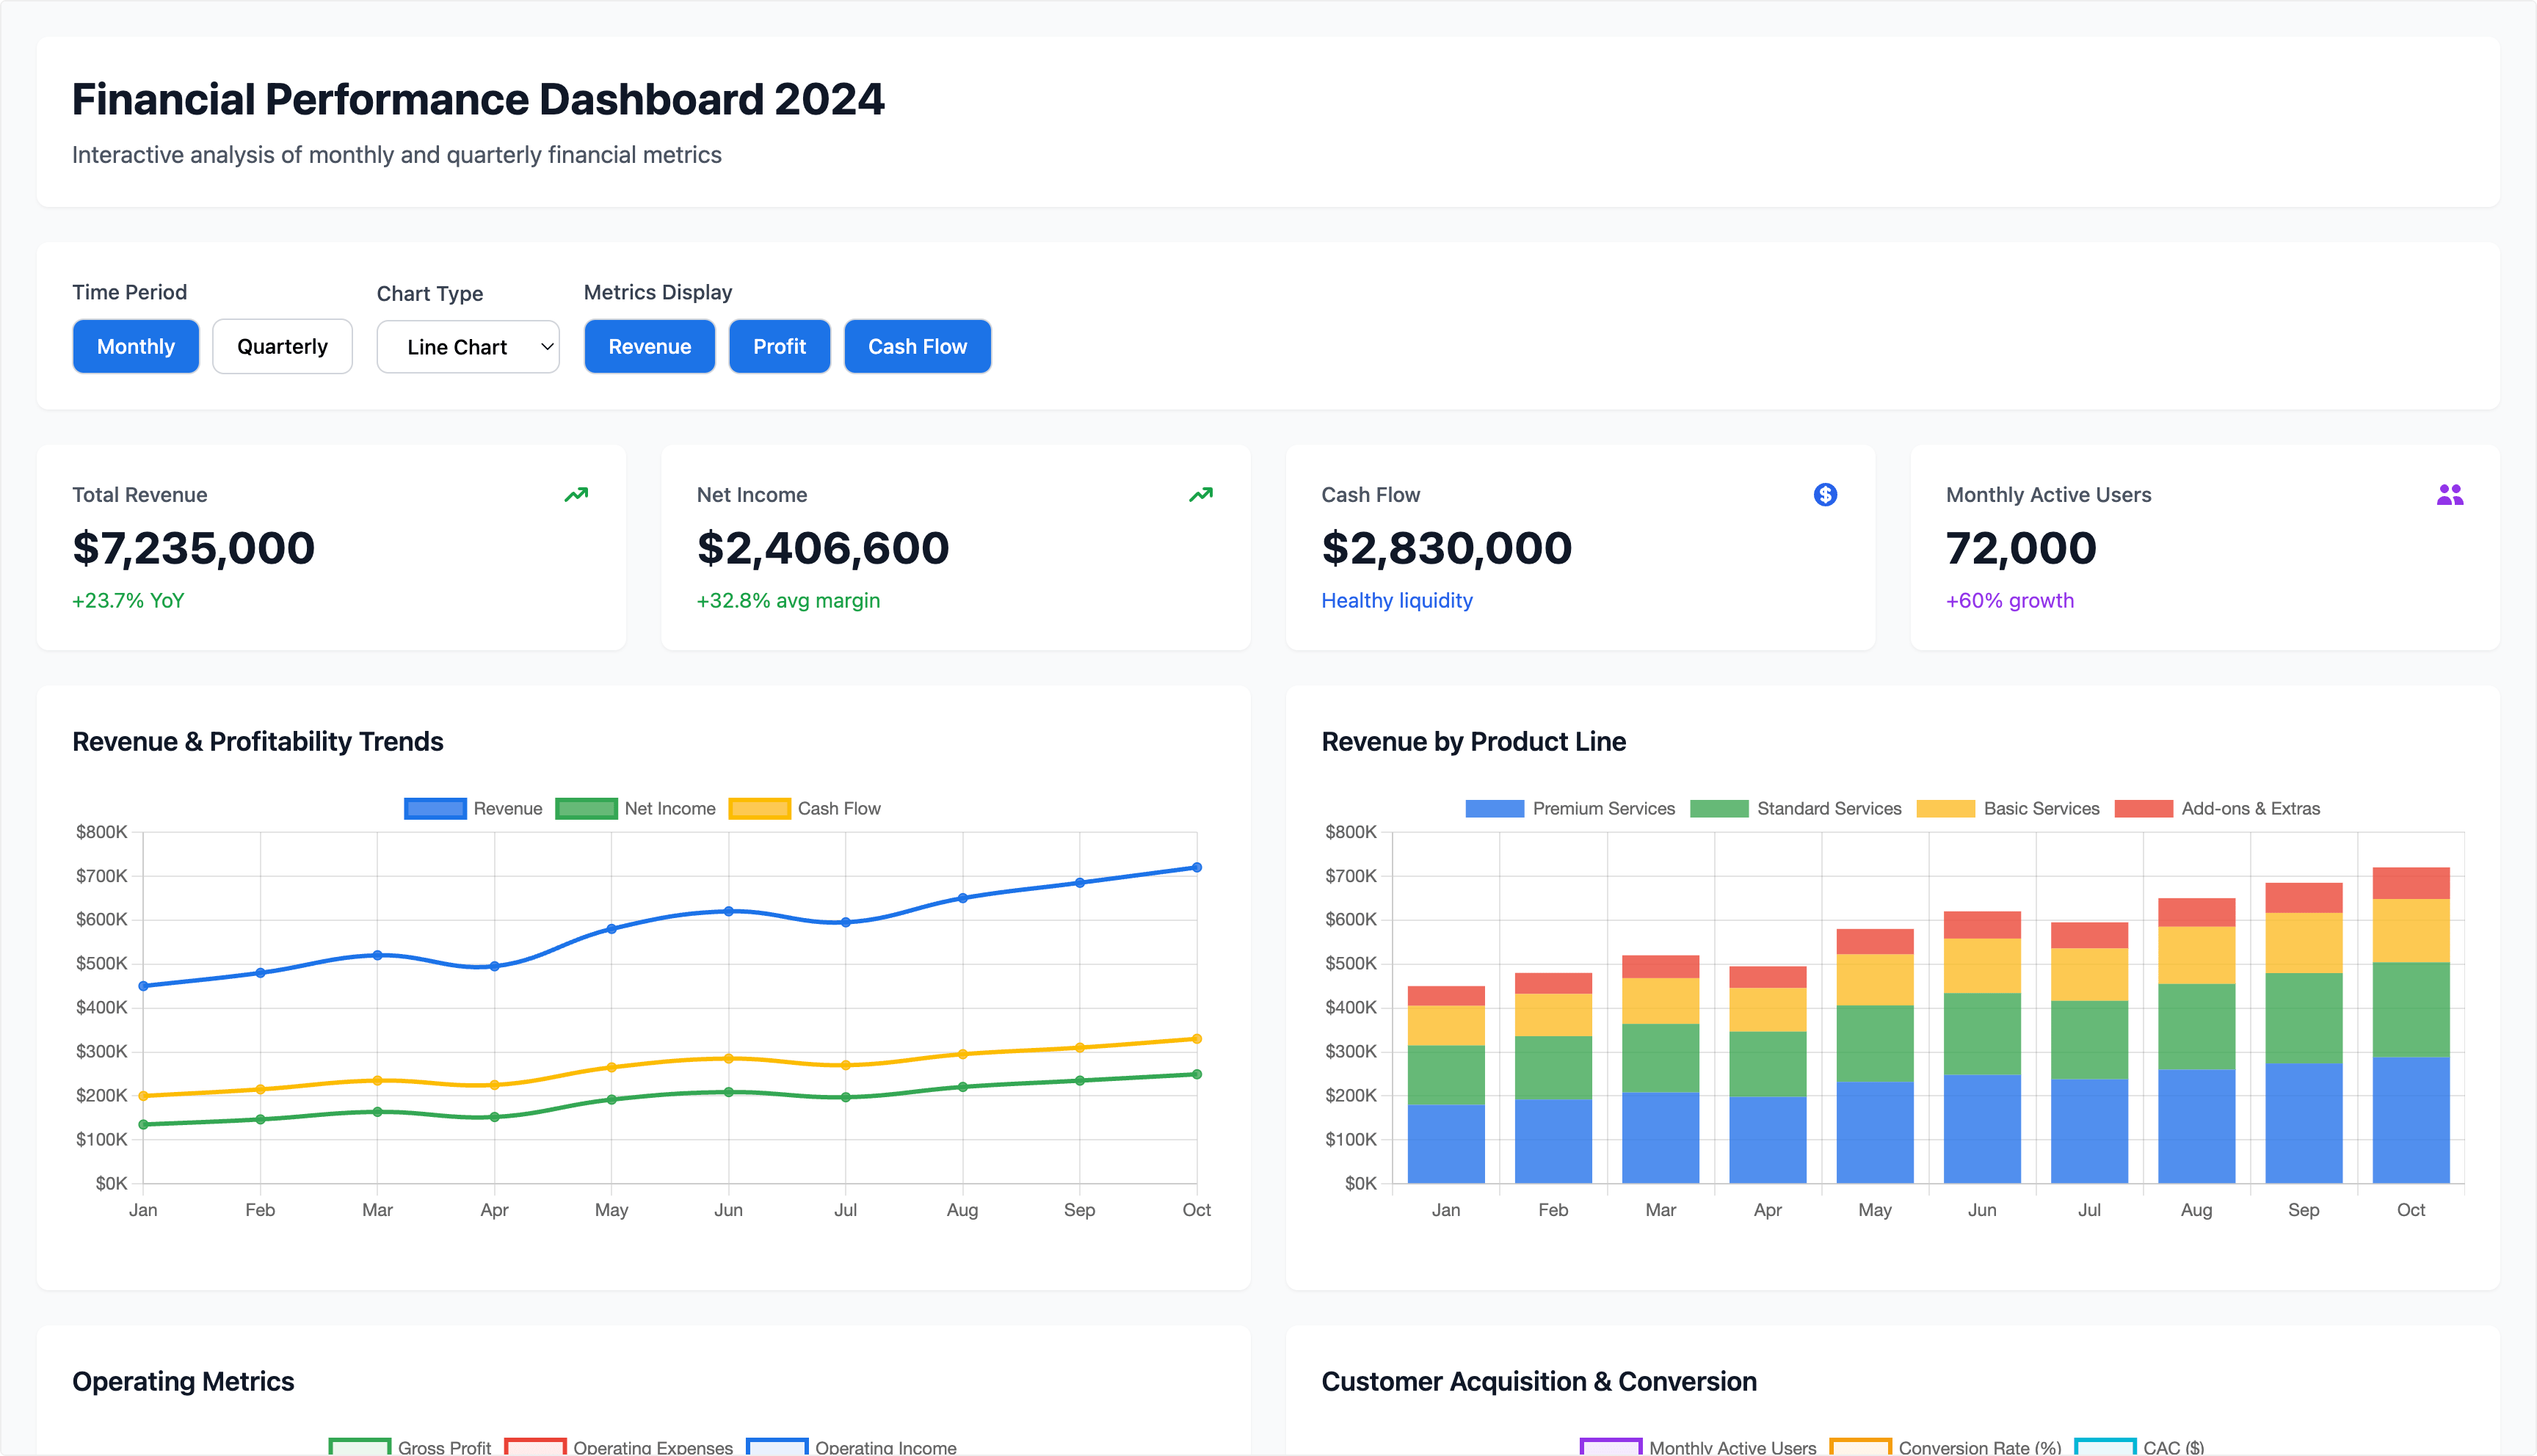
The generated dashboard includes comprehensive features such as key metrics cards displaying total revenue, net income, cash flow, and monthly active users. Interactive filters allow you to toggle between time periods (Monthly/Quarterly), switch chart types (Line/Bar/Area), and control which metrics are displayed. Multiple visualization types are automatically generated including trend lines, stacked bar charts, and comparative views.
User interface assets can also be used to generate form inputs, data entry screens, and other interactive components beyond dashboards.
The generated dashboard includes comprehensive features such as key metrics cards displaying total revenue, net income, cash flow, and monthly active users. Interactive filters allow you to toggle between time periods (Monthly/Quarterly), switch chart types (Line/Bar/Area), and control which metrics are displayed. Multiple visualization types are automatically generated including trend lines, stacked bar charts, and comparative views.
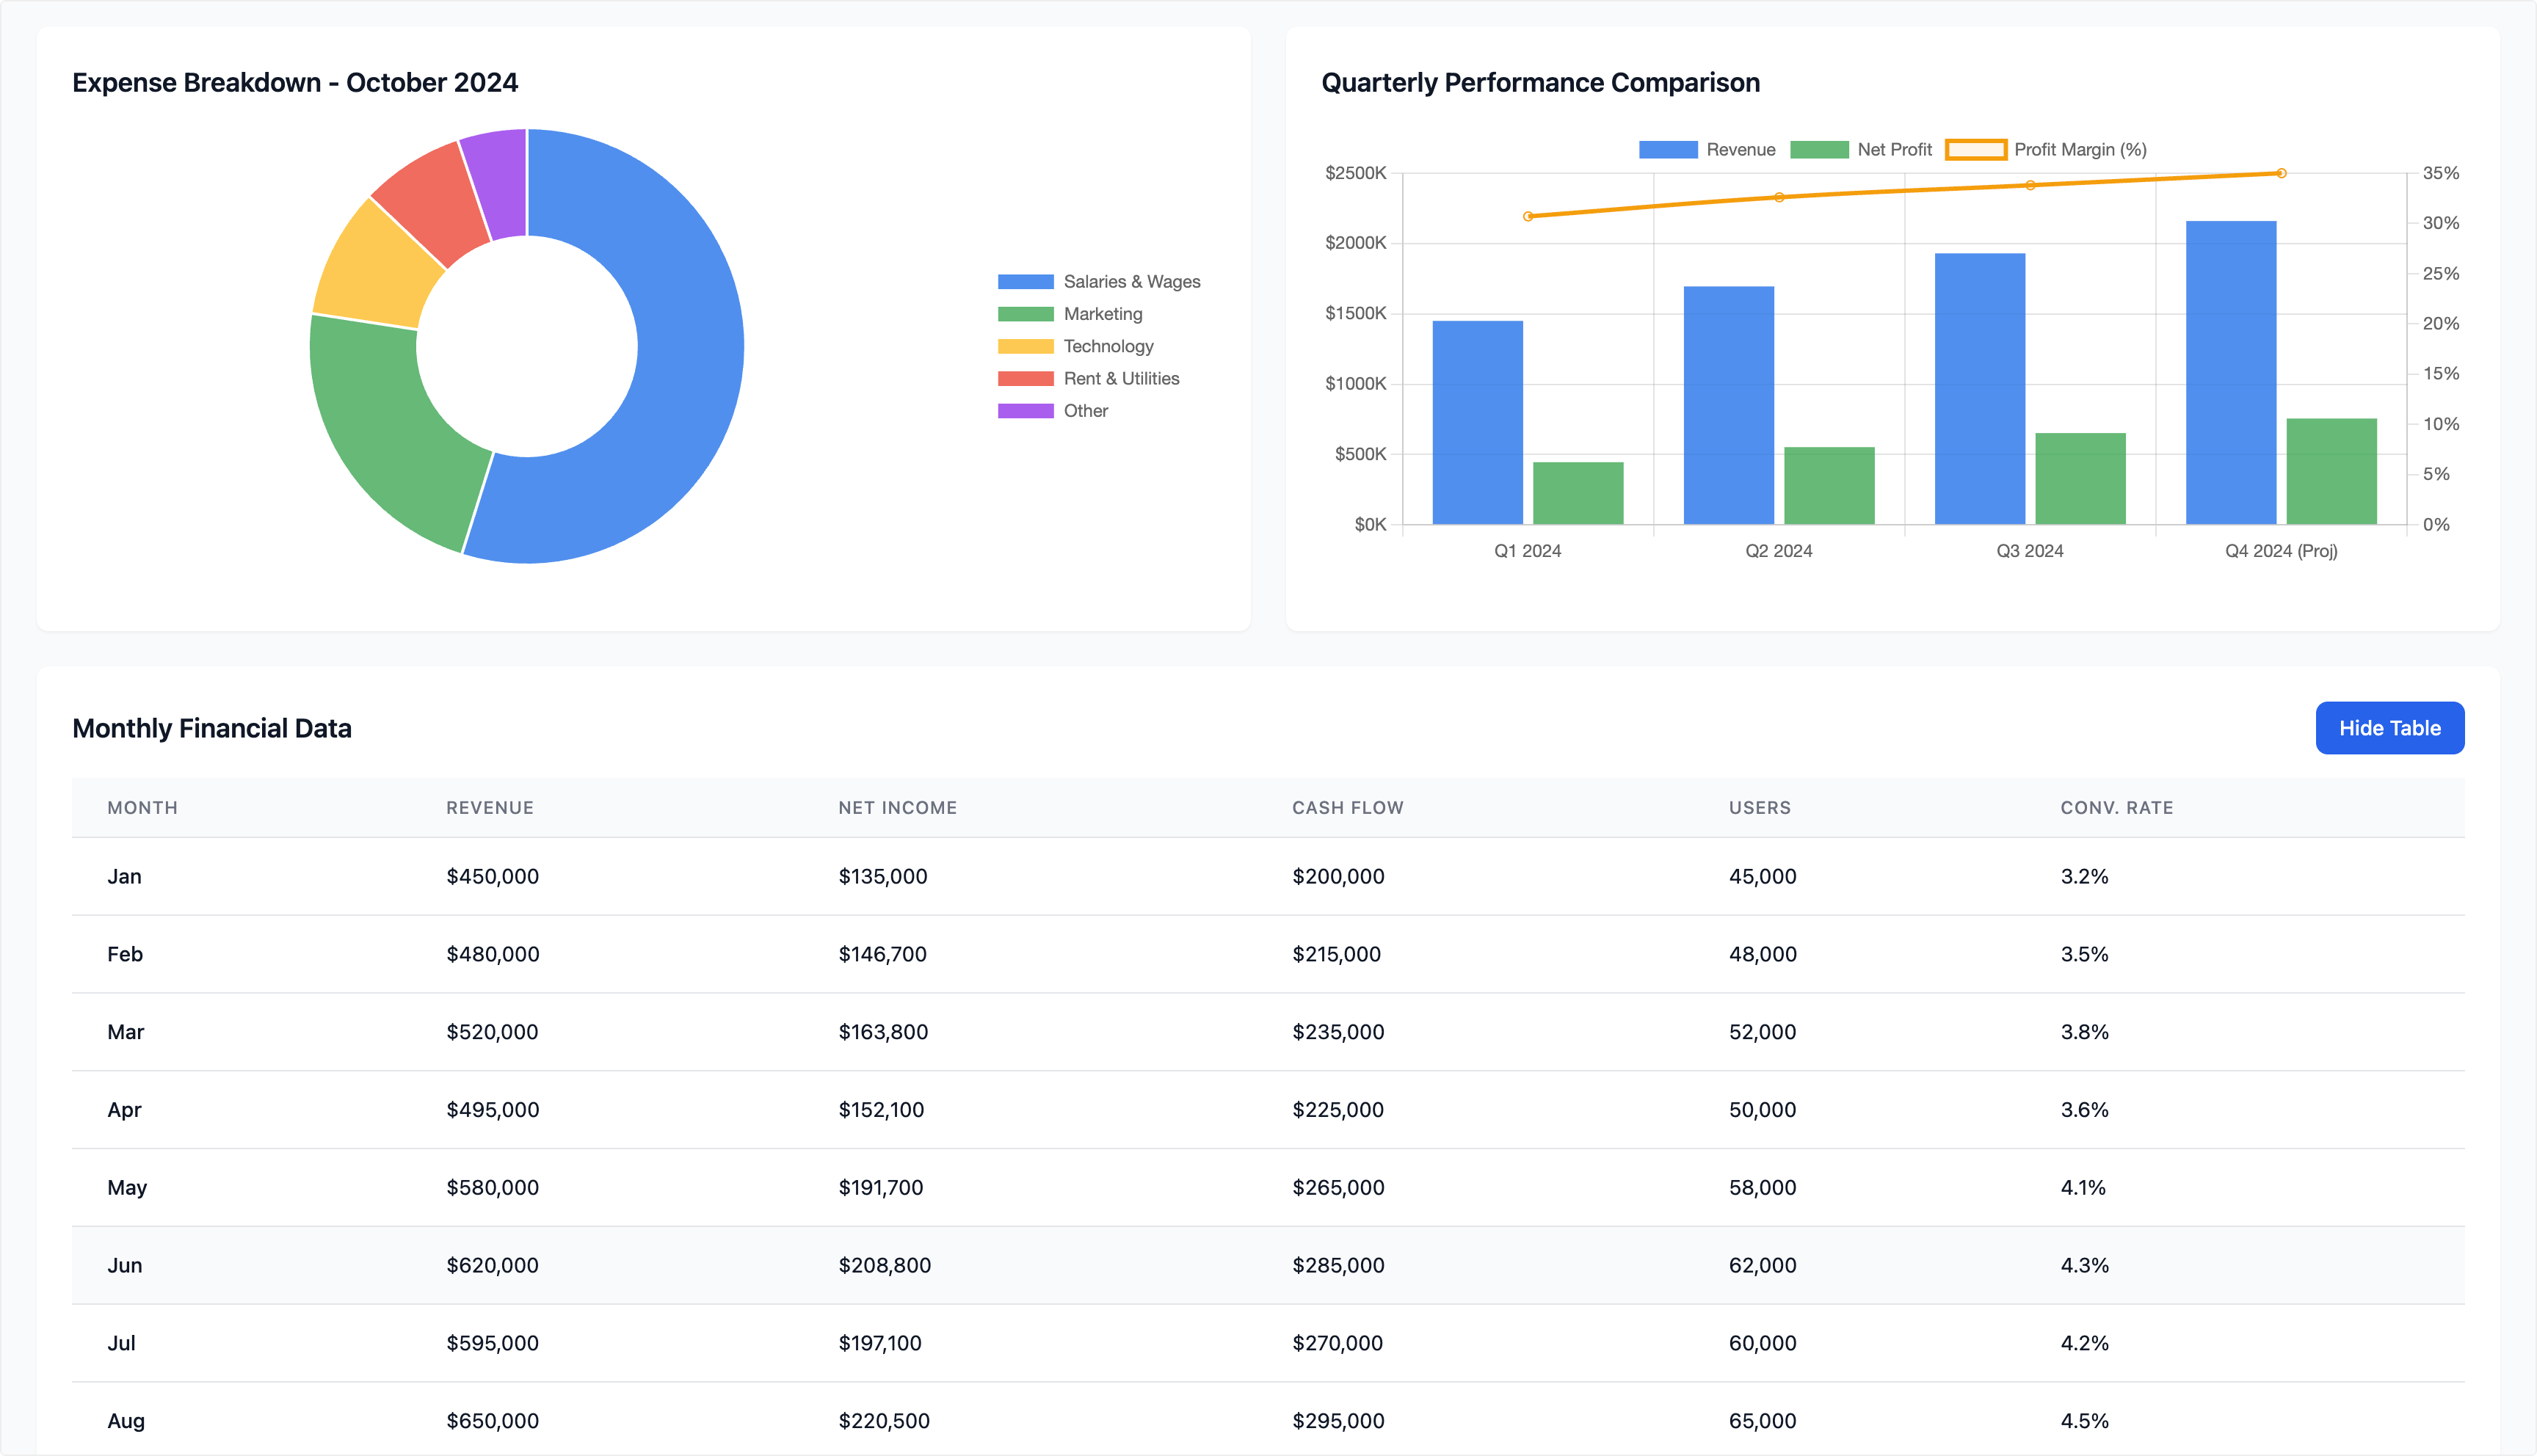
 Scroll through the dashboard to view additional visualizations including expense breakdowns, quarterly performance comparisons, and detailed data tables. Each user interface generates an independent shareable link that allows people without Athena access to view and interact with the dashboard. This makes it easy to distribute insights to stakeholders, clients, or team members who don't have platform access.
 This documentation is built and hosted on [Mintlify](https://mintlify.com), a developer documentation platform.